Designing reliable data splits
 Instruction and application
 In Progress
Imagine your model performs perfectly in testing—but once deployed, results become inconsistent. The issue? Overlap between training and test data.
Reliable data splits are key to fair, reproducible, and trustworthy model evaluation. In this section, you’ll learn how to design and validate data partitions that prevent leakage, support generalisation, and ensure your model’s performance reflects real-world results.

Why data splitting matters
When training supervised learning models, we typically know the true relationship between the input (independent) and output (dependent) variables within our sample.
But the real question is: How well will this model perform on new, unseen data?
If we evaluate the model using the same data we trained it on, the results will look artificially strong, because the model has already “seen” those patterns. Instead, we must evaluate on data it hasn’t encountered before.
To do this, we use data splitting orcross-validation to hold back part of our dataset for testing. This approach reduces overfitting, improves model generalisation, and gives a more reliable estimate of how our model will perform in real-world use. A well-designed split ensures:
- **Representativeness:**Each subset reflects the diversity of the full dataset.
- **Fair evaluation:**The model is tested on truly unseen data.
- Reduced overfitting : Training focuses on general patterns, not memorisation.
Common data splitting strategies
Let’s explore how different data-splitting strategies work and how to avoid common pitfalls.
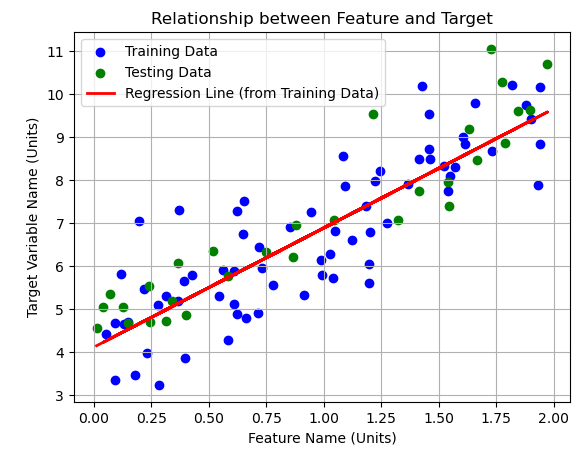
Train test split This is the simplest form of data splitting where we partition our data into two sets - a “training” set which will be used to train the model and a “test” set which will be used to evaluate it.How it works
- Typically, data values are assigned randomly to either of the two sets (we usually shuffle the data first to ensure the split is representative of the entire dataset).
- The training set is the larger of the two, with 70 - 80% of values assigned and the rest reserved for the testing set.
- The model is trained solely on the training set and its performance is measured using the test set using an appropriate metric (e.g. accuracy, r-squared, RMSE).
When to use it
- When the dataset is relatively large - we need enough data so both sets can provide reliable estimates of the generalisation performance.
- When we need a quick and easy way to get an initial estimate of model performance.
Benefits
-
**Simplicity:**It is straightforward to implement and explain.
-
**Computation efficiency:**Compared to other techniques, it is computationally inexpensive.Risks
-
**High variance in performance estimate:**The metric we calculate is highly dependent on how the data is split, which is done at random. If we rerun the process we might get wildly different results each time.
-
**Potential for unrepresentative splits:**Due to the random assignment, it is possible that both the training or test sets might not have the same distribution of features or target variable, leading to a biased evaluation. This is particularly true when the data is small.
-
Wasted data: As you are holding back 20 - 30% of the data from training, you have reduced the amount of information the model can learn from.K-fold cross-validationInstead of performing a single train-test split, we can divide the data into k equally sized partitions or “folds”. The model is trained and evaluated the same number of times (k), where in each iteration one of the folds is held back as the test set and the remaining are used for training.
At the end of the process, we take the average of all the performance metrics as our value.
How it works After the data has been shuffled, we split the data into k folds of (approximately) equal size. For example, let’s say we have 5:
12345
You can have as many folds as you like, but remember the more folds you have, the less information will be in each, increasing the chance of folds being unrepresentative. The iterative process begins with one of the folds (let’s say the first) is held back and the rest are used to train the model.
12345
The resulting model is evaluated with the held-back fold and the performance metric is recorded. The process is repeated until each fold has been held-back once.
12345123451234512345
After, we will have k different performance scores (in this case 5). The final performance score of the model is found by averaging these scores.
When to use it
- When the data is moderate to small. It makes more efficient use of the available data by using each for training and testing (in different iterations).
- For more reliable model evaluation compared to a single train-test split, as it provides multiple evaluations across different subsets of the data.
- For hyperparameter tuning, as it can be used to evaluate the performance with different hyperparameter settings, helping us choose the best configuration.
Benefits
-
More robust performance estimate: by averaging the results across k different test sets, it provides a more stable and less biased estimate of the model's generalisation performance compared to a single train-test split.
-
Better utilization of data: each data point is used for both training and testing across the k iterations, making it particularly useful when the dataset is limited.
-
Provides insights into the model's stability: the variance in the performance scores across the k folds can give an indication of how sensitive the model's performance is to the specific choice of training data.Risks
-
Computational cost: training and evaluating the model k times can be computationally more expensive than a single train-test split, especially for large datasets and complex models.
-
Potential for dependence between folds (if not shuffled properly): if the data has some inherent ordering or grouping and is not shuffled before splitting into folds, the folds might not be truly independent, which could lead to biased performance estimates.Stratified cross-validationCan you see a problem that might happen with cross-validation if using it with a classification model and an imbalanced dataset? As the data is assigned to folds at random, it is likely that each fold will have different proportions of the target variable - with some folds possibly having no instances of the minority label. Instead, we can use a stratified approach to ensure that each fold has the same proportions of the target variable.How it works
Similar to K-Folds cross-validation, the dataset is divided into k folds of approximately equal size. However, with this approach we ensure that each fold contains approximately the same proportion of observations with each target value as the original dataset.
For example, imagine that we are building a model to predict a binary classification, with data split between the two labels as following:
AB8020
As the data has an 80 - 20 split, we want each fold to retain this proportion. Let’s say we want 5 fold, we would there want the following values:
1234516 : 416 : 416 : 416 : 416 : 4
So when assembling fold 1, we would randomly pick 16 from Class A and 4 from Class B (and do the same for folds 2 - 5). Once the data folds have been created, we follow the same cross-validation process as before.
When to use it
- When dealing with classification problems, where the classes in the target variable are imbalanced. This ensures that the model is evaluated on a test set that reflects the class distribution of the overall dataset.
Benefits
-
**Improved performance estimation on imbalanced datasets:**By ensuring that each fold has a representative class distribution, stratified cross-validation provides a more reliable estimate of the model's performance, especially for the minority class(es). This helps in avoiding situations where a fold might contain very few or no instances of a particular class, which could lead to misleading performance metrics.
-
**More stable and reliable evaluation:**It reduces the risk of having a test set that is particularly easy or difficult due to an unrepresentative class distribution.Risks
-
Implementation complexity: Implementing stratified splitting can be slightly more complex than a simple random split, especially when dealing with multiple target classes or continuous target variables (in stratified K-fold for regression, the target variable is often binned).
-
May not be necessary for perfectly balanced datasets: If the class distribution is already uniform, standard K-fold cross-validation might be sufficient.
-
Potential for issues with very small minority classes: If a minority class has very few instances, it might be challenging to ensure that each fold has at least one instance of that class, especially with a large number of folds.Other relevant techniquesHere are some other techniques you might want to research to help you evaluate your model’s performance on different data to which you trained it.
-
Nested cross-validation: Used when performing both hyperparameter tuning and model evaluation. The inner loop tunes parameters, while the outer loop evaluates performance—producing a less biased estimate.
-
Time series cross-validation: For sequential data, models are trained on past observations and tested on future ones to prevent information leakage across time.
-
Bootstrapping: Creates multiple resampled datasets (with replacement) to estimate the uncertainty or confidence intervals of performance metrics.
-
A/B testing: Deploys different model versions to user groups in real environments to directly compare real-world performance.
Avoiding data leakage
Even the best validation plan can fail if data leakage occurs. Leakage happens when information from the test set accidentally influences the training process, giving your model an unfair advantage. The result? Inflated accuracy, misleading evaluation metrics, and disappointing real-world performance once deployed.
Think of leakage as a model “peeking at the exam answers” before the test—it may look brilliant on paper, but it hasn’t truly learned to generalise.
Common causes of data leakage
- **Preprocessing before splitting:**Performing tasks like scaling, encoding, or imputing before dividing the data means that information from the test set can leak into the training process. For example, scaling based on the mean and standard deviation of the full dataset allows the model to indirectly “see” the test data distribution.
- **Temporal leakage:**In time-series data, using future information (like a stock price or patient outcome that occurs after the prediction point) during training breaks the natural time order. This gives your model knowledge it could never have in real-world use.**Feature leakage:**Sometimes features are unintentionally correlated with the target variable. For instance, including a “discharge date” when predicting hospital readmission risk gives away part of the outcome itself.
Prevention strategies
- **Split before preprocessing:**Always divide your dataset into training, validation, and test sets before applying any transformation. This ensures that scaling, encoding, and imputation are performed only within the training process.
- **Use pipelines:**Automating preprocessing steps within a pipeline (e.g., using Scikit-learn’s Pipeline) keeps transformations consistent and prevents accidental reuse of information from the test set.
- **Isolate the test set:**Treat the test data as sacred. It should never be used in model design, feature selection, or hyperparameter tuning. Only use it once—to evaluate your final model’s generalization.
- **Watch for anomalies:**An unusually high test accuracy or performance gap between training and validation may signal leakage. When results seem too good to be true, they probably are. <g></g><defs><clipPath><rect width="24" height="24" fill="white"></rect></clipPath></defs>## Case study: Preventing data leakage at FinSmart Analytics FinSmart Analytics, a digital lending company, is developing a machine learning model to predict loan defaults. The dataset includes applicant demographics, credit history, transaction behaviour, and repayment records.
Challenge: The initial model reported 97% accuracy on the test set — an unusually high result that impressed the leadership team. However, when the model was tested on a new batch of applications, accuracy dropped sharply to65%. A review revealed multiple instances ofdata leakage:
-
The team had performed normalization and feature scaling on the entire dataset before splitting it into training and testing sets.
-
Several engineered features were derived from future repayment outcomes, which wouldn’t exist at the time of loan approval.Action taken: To fix the issue, the data scientists:
-
Re-split the dataset into training, validation, and test sets before any preprocessing.
-
Implemented a pipeline-based workflow to keep test data isolated throughout the process.
-
Removed any features that introduced future information or indirect correlations with the target variable.
Outcome: After the fix, the model achieved a realistic 82% accuracy with stable validation performance. The results reflected genuine predictive capability, and the model successfully passed an internal audit for fairness and reliability.Key takeaway: High accuracy isn’t always a sign of success, sometimes it signals data leakage. Proper data splitting and pipeline discipline are essential for building models that perform consistently in the real world and maintain stakeholder trust.
Action item: Quiz - Reliable data splitting in action
Before moving on, see if you can apply what you've learned by answering the knowledge check questions below.