Model calibration for trustworthy predictions
 Instruction and application
 In Progress
 Imagine unlocking your model’s hidden potential with just a few well-placed tweaks.
Real performance isn’t only determined by the model itself, it depends on how well its hyperparameters are tuned. Even minor adjustments can dramatically improve a model’s accuracy, efficiency, and stability.
In this section, you’ll learn how to adjust these critical settings to boost accuracy, reduce errors, and unlock your model’s full potential.
Understanding model calibration
Model calibration refers to the property of a classification model where its predicted probabilities align with the actual likelihood of an event occurring.
In a perfectly calibrated model, if it predicts a probability of 70% for a certain class, then across many instances where this prediction is made, the actual proportion of times that class occurs should be close to 70%. Essentially, calibration assesses the trustworthiness of the predicted probabilities as estimates of the true underlying probabilities.
Model calibration helps us:
Evaluate unreliable probability estimates: Some ML models like Support Vector Machines, Gradient Boosting Machines and Neural Networks are not inherently calibrated. Their predicted probabilities might be skewed and not accurately reflect the true likelihood of the class.
- Avoid poor decision-making based on probabilities: If the predicted probabilities are not calibrated, decisions based on them may be flawed. For example, if a model predicts a 60% chance of a customer churning, but the true probability is closer to 80% then business decisions based on this will be misguided.
Calibration techniques
Let’s look at a couple of calibration techniques.
Platt scalingThis is a parametric method used to calibrate the probability outputs of a binary classifier. It fits a Logistic Regression model to the classifier’s scores (e.g. a decision tree or SVM) to map them to probabilities in the range [0, 1].How it works
- Train a calibrator: given the predictions of the uncalibrated classifier on a separate calibration set (distinct from the training and test sets), Platt scaling fits a Logistic Regression model of the form.
P(y=1∣f)=11+exp(Af+B)P(y = 1 \mid f) = \frac{1}{1 + \exp(Af + B)}P(y=1∣f)=1+exp(Af+B)1
Where f is the output of the uncalibrated classifier and A and B are parameters that are learned by a minimizing loss function on the calibration set with respect to the true binary labels.
-
**Applying the calibrator:**once the parameters A and B are learned, this logistic function can be used to transform raw scores of the original classifier on new, unseen data into calibrated probabilities.When to use it
-
Used with binary classification whose output is not well-calibrated, such as a Support Vector
-
Machine or certain tree-based models.
-
When we need well-calibrated probability estimates for decision-making.
Benefits
-
Simple and easy to implementas it involves fitting a standard logistic regression model.
-
Effective for many binary classification scenarios especially when the calibration curve has a roughly sigmoid shape.
-
Can improve the reliability of probability estimates from uncalibrated classifiersRisks
-
Parametric assumption: Assumes that the miscalibration can be corrected by a sigmoid function. This might not always be the case, especially for more complex miscalibration patterns.**Requires a separate calibration set:**This reduces the amount of data available for training the main classifier. If the calibration set is too small, the estimated parameters (A) and (B) might not be reliable.Not well-suited for multi-class calibration directly: While it can be applied in a one-vs-rest or one-vs-one manner for multi-class problems, more specialized multi-class calibration techniques might be preferred.Miscalibrated classifier: May not perform well if the original classifier is severely miscalibrated.Isotonic RegressionThis is a non-parametric method for calibrating the probability outputs of a classifier. It fits a piecewise constant, non-decreasing function to the classifier’s scores and the true labels on the calibration set.
The non-decreasing constraint ensures that higher scores are mapped to higher or equal probabilities, which is a desirable property for calibration.
How it works
- Training a calibrator: given the predictions of the uncalibrated classifier on a separate calibration set and the corresponding true binary labels y∈{0,1
}y \in {0, 1`}y∈{0,1}`, isotonic regression finds a non-decreasing function g(f) that best maps the scores f to probabilities.
This is typically done by minimizing the squared difference between g(fi)g(f_i)g(fi) and yiy_iyi subject to the constraint that g(fi)≤g(fj) whenever fi≠fjg(f_i) \leq g(f_j) ; \text{whenever} ; f_i \neq f_jg(fi)≤g(fj)wheneverfi≠fj.The resulting calibration function is a step function.
-
Applying the Calibrator: once the isotonic regression model is fitted on the calibration set, it can be used to transform the raw scores of the original classifier on new data into calibrated probabilities by looking up the corresponding probability value from the fitted piecewise constant function.When we use it
-
For binary classification models that are miscalibrated, we want a non-parametric calibration method that can handle more complex miscalibration patterns than Platt scaling
Benefits
-
Non-parametric: Can fit more complex calibration curves than Platt scaling.
-
Guaranteed to produce non-decreasing calibrated probabilities, preserving the relative ordering of the original scores.
-
Can be more accurate than Platt scaling when the miscalibration is not well-represented by a sigmoid function.Risks
-
Requires a separate calibration set.
-
Can be more prone to overfitting the calibration data if the calibration set is small, resulting in a very wiggly step function.
-
The output is a piecewise constant function, which might not be as smooth as the output of Platt scaling.
-
Can be less effective if the original classifier's scores are not well-ordered with respect to the likelihood of the positive class.
Visualising and evaluating calibration
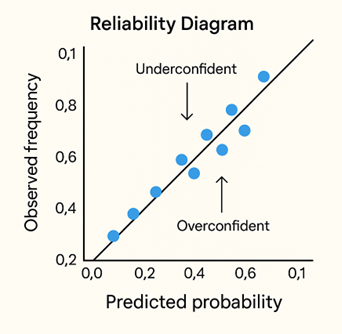 Calibration can be visualised using a reliability diagram, which plotspredicted probabilities againstobserved frequencies.
- In a well-calibrated model, the points align closely with the diagonal line, indicating that the predicted probabilities match real-world outcomes.
- When the curve rises above the diagonal, the model isoverconfident—it predicts higher probabilities than what actually occurs.
- When it falls below the diagonal, the model isunderconfident, predicting lower probabilities than reality.
Measure calibration quality with the Brier score
- To quantify calibration quality, we use the Brier score, which measures themean squared difference between predicted probabilities and actual outcomes.
- Lower Brier scores indicate that the model’s predicted probabilities are more reliable and better aligned with observed results.

Action item: Reflection - Calibrating for trust
Before moving on, take a few minutes to consider the questions below.