Defining variance
 Instruction and application
 In Progress
Defining variance
Now that we’ve explored how bias causes underfitting through oversimplification, let’s complete the picture by looking at the opposite problem: variance.

What is variance in machine learning?
In machine learning, ** variance** refers to how much a model’s predictions fluctuate when it is trained on** different subsets of the same data** . High variance means the model is overly responsive to the specific details of the training data—including random noise or outliers—rather than learning the** underlying general patterns** .
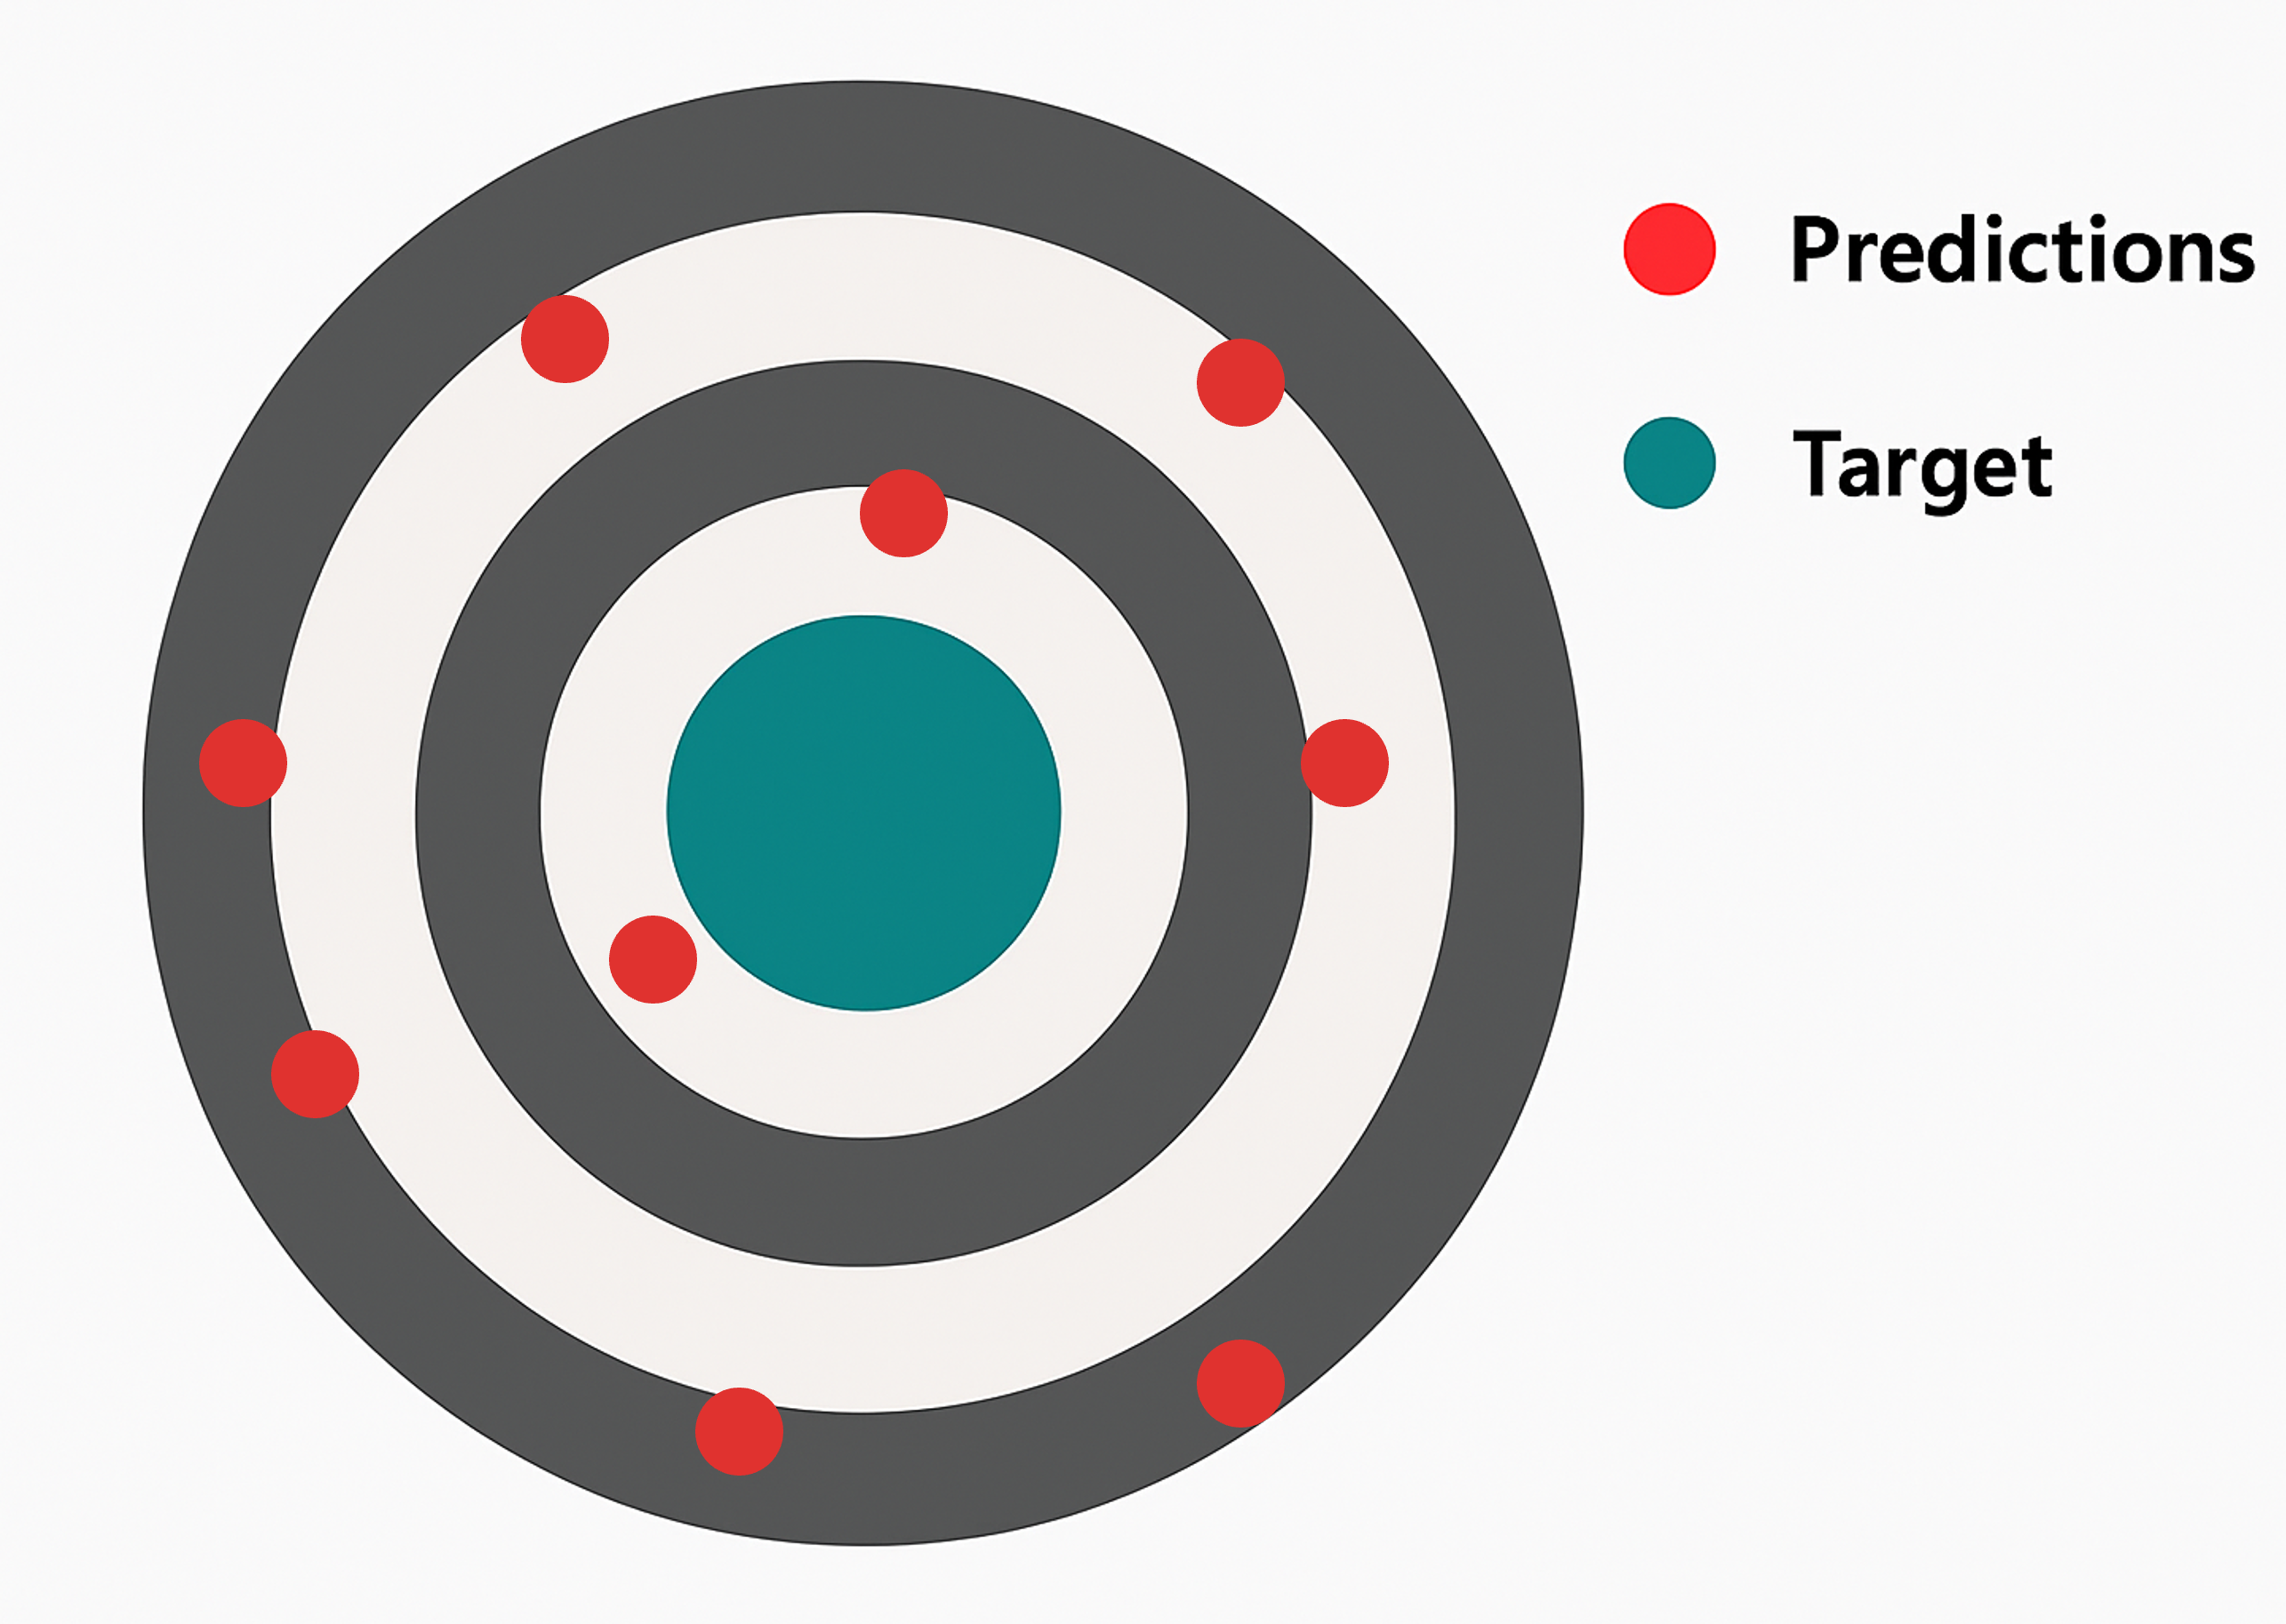
If high bias is like a dart player who always misses in the same direction, high variance is like one who throws wildly—sometimes hitting near the target, other times missing entirely. There’s no consistent pattern.
The dartboard diagram illustrates how a high-variance model produces inconsistent results: the red dots are predictions scattered across the board, showing the model’s instability across different training sets. While it may occasionally hit close to the mark, the overall pattern lacks reliability.
When variance is too high, a model may appear to perform extremely well during training, but when exposed to new or slightly different data, its performance drops dramatically. This is because the model has ** memorised the training examples** , instead of learning** rules that generalise** beyond them.** This excessive sensitivity causes the model to chase noise—treating insignificant fluctuations as if they were meaningful patterns—resulting in fragile and unreliable predictions on new data.**
This is known as ** overfitting**—and it’s a common pitfall, especially with complex models like deep decision trees, high-degree polynomial regressions, or unregularised neural networks.
High-variance models typically:
- Are ** too complex** for the problem space—they have too many parameters or degrees of freedom.
- Create ** highly specific prediction boundaries** that try to fit every quirk in the training set.
- Make ** inconsistent or erratic predictions** when faced with new or even slightly perturbed input data.
- Have ** low bias**(they can capture detailed patterns) but** poor generalisation**(they fail to perform well on unseen data). In short, high variance is the cost of being overly “flexible”—the model listens too closely to the training data, losing sight of what actually matters.
Example: Variance and overfitting in action
Let’s say you’re building a model to predict customer churn using a dataset with variables such as:
- Customer age
- Tenure
- Usage patterns
- Service complaints You choose a highly flexible decision tree model and allow it to grow deeply—meaning it splits the data until it perfectly fits nearly every detail of the training set.
At first, things look great:
- The model performs exceptionally well on training data.
- It predicts past churn cases almost perfectly.
- But when you test it on new, unseen customers, performance drops sharply.** What happened?**
The model overfitted. It learned not only the meaningful patterns but also the random noise, quirks, and outliers in the training data. It became too specific—too tailored to the examples it saw during training—and lost the ability to generalise.
This is a textbook case of high variance. The model’s excessive sensitivity caused it to chase noise—treating insignificant fluctuations as if they were meaningful. The result? Unstable predictions and unreliable performance in real-world conditions.
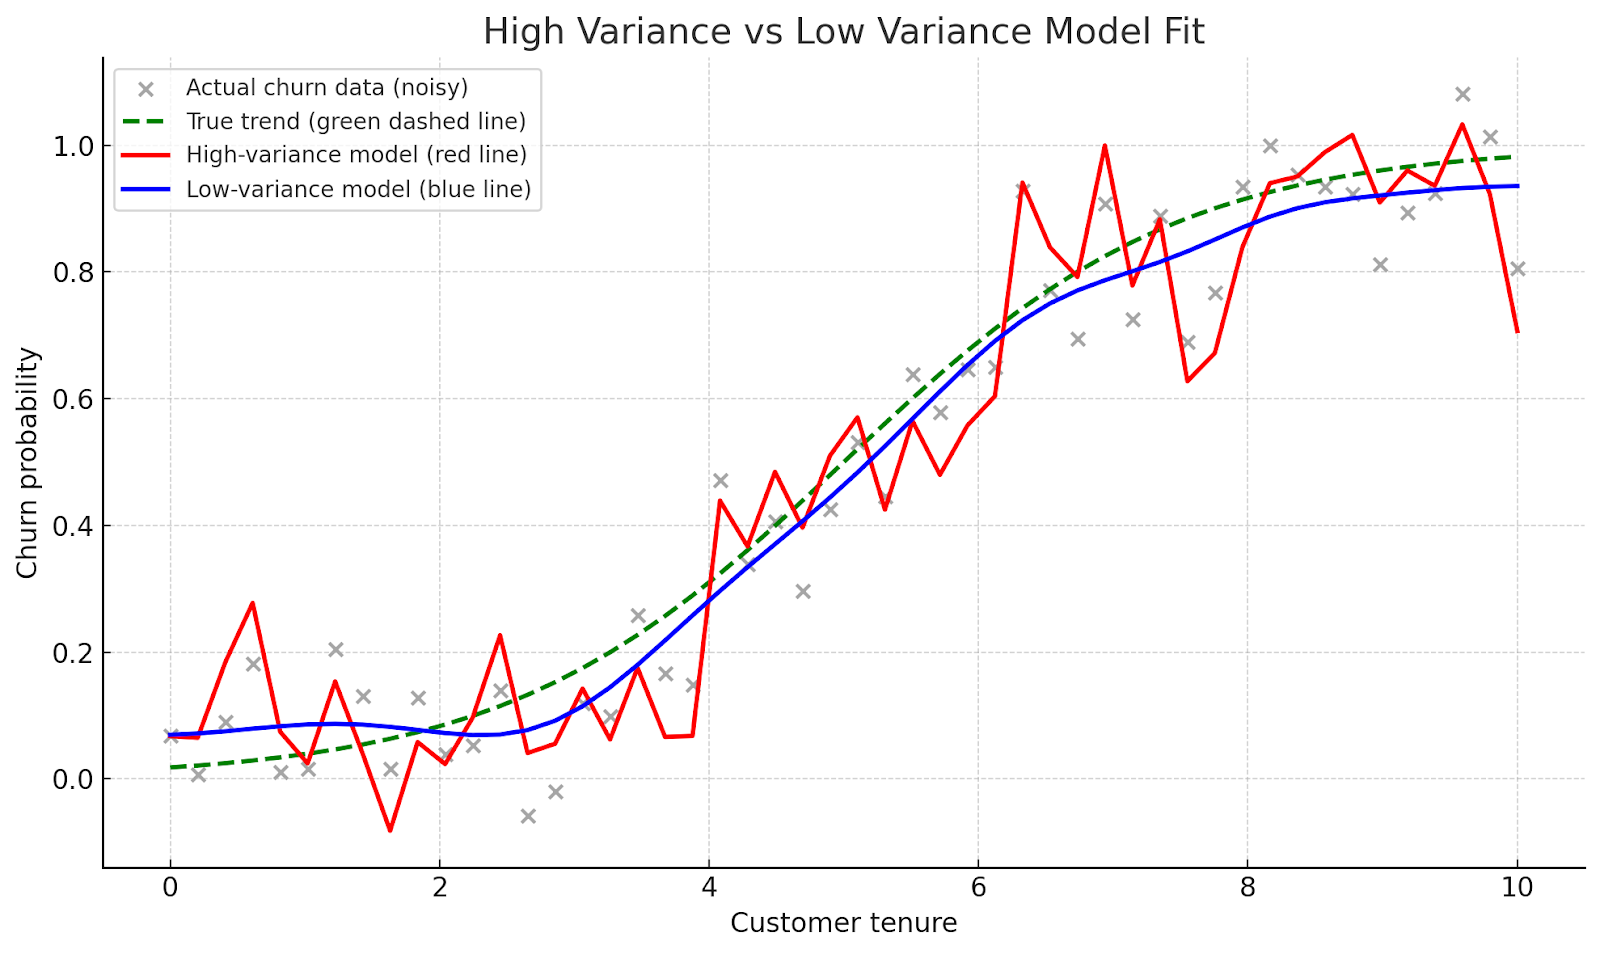
The graph below illustrates this concept by comparing how a high-variance model and a low-variance model behave on the same dataset:
- ** Gray dots**: Actual (noisy) churn data based on customer tenure.
- ** Green dashed line**: The underlying** true trend** that reflects real churn behaviour.
- ** Red line**: A** high-variance model** that weaves erratically through nearly every point—overfitting to training noise.
- ** Blue line**: A** low-variance model** that approximates the true trend and generalises better.
 ** Action item: Mini-scenario reflection**
** Scenario** You train a highly flexible model on your customer churn dataset. It performs nearly perfectly on training data. But when you deploy it or test it on new customers, its predictions fluctuate wildly—even when customers seem very similar to those it has already seen.** Reflection prompts** Take a moment to think about the behavior of your model in this scenario. Then respond to the following reflection questions.
Focus on how the model reacts to new or slightly different data.
Consider how variance affects reliability and generalisation.
Think about trust, fairness, or operational impact.