The bias-variance tradeoff
 Instruction and application
 Complete
Simplicity vs. Complexity
** Every model tells a story—but only the best ones strike the right balance between simplicity and complexity.**
This is where the bias–variance tradeoff comes in, revealing how we tune models to avoid being either too naive or too reactive. Finding the sweet spot is key to building high-performing models.

Understanding the tradeoff
The ** bias-variance tradeoff** explains how** model complexity** affects a model’s ability to** generalise** to unseen data.
Simple models (High bias)
Models like linear regression with limited features often have ** high bias** . They make strong assumptions, leading them to** underfit**—missing meaningful patterns and producing inaccurate results on both training and test data.
- ** Example:** Predicting housing prices using only the number of bedrooms, ignoring location or square footage.
Complex models (High variance)
Complex models like deep neural networks tend to have ** low bias** but** high variance** . They are so flexible they "memorise" the training data, including noise, leading to** overfitting** .
- ** Example:** A sentiment model that learns to associate random emojis with sentiment just because they appeared frequently in training.

The Balancing Act
- Reducing bias typically increases variance.
- Reducing variance often increases bias.
- Pushing too far in either direction leads to poor real-world performance.
Error decomposition
To truly understand the tradeoff, we break down total model error into three core components:
- ** Bias² (Error from simplicity):** Decreases as complexity increases.
- ** Variance (Error from sensitivity):** Increases as complexity increases.
- ** Irreducible Error:** Inherited noise in the data that cannot be eliminated.
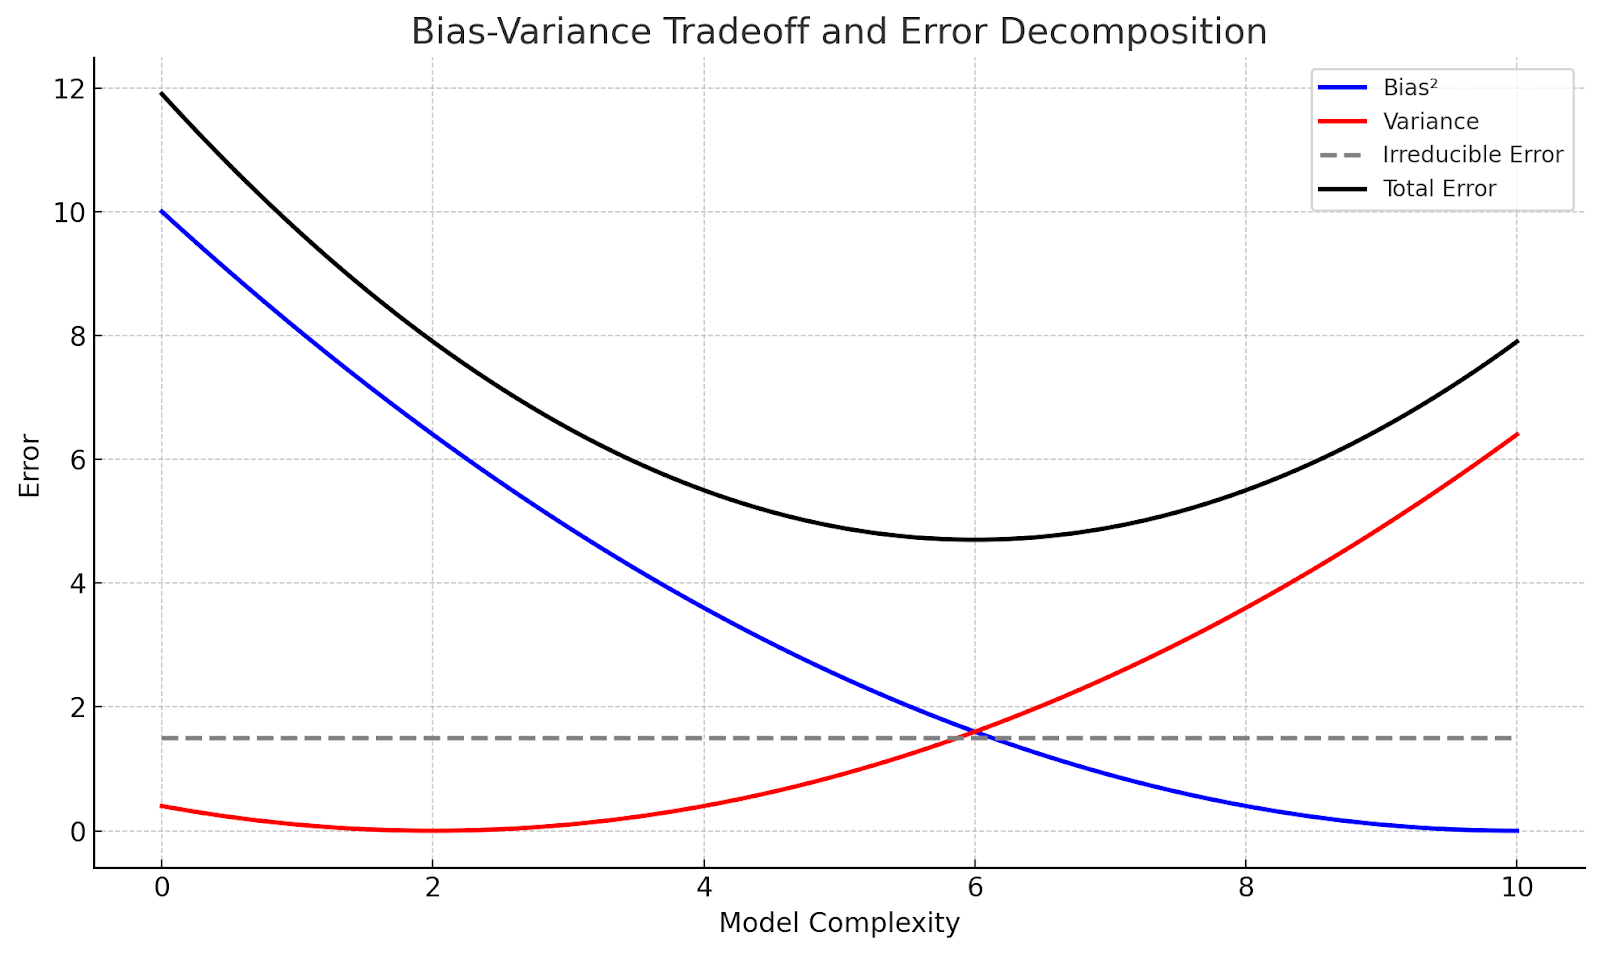
The Total Error forms a U-shaped curve, revealing the optimal complexity.
Case study: Energy demand forecasting
A utility company predicts household energy usage to avoid blackouts or overspending.
- ** Too simple (High bias):** Uses only time of day. Under-predicts on hot days (A/C usage).** Impact:** Operational shortfalls and blackouts.
- ** Too complex (High variance):** Uses appliance-level data. Overfits to historical noise.** Impact:** Unpredictable procurement and wasted resources.
- ** Just right (Balanced):** Uses time of day, temperature, and stable behavioral summaries.** Impact:** Reliable forecasting and cost control.

Action item: Quick reflection
Now that you’ve explored how bias and variance respond to complexity, take a moment to reflect on your own projects.
Type your reflection here...
Type your reflection here...