Example solution
 Instruction and application
 Complete
Predicting Virality
Ever wondered what makes a song go viral? Imagine being able to predict a track’s popularity before it even hits the airwaves—just by analysing its tempo, energy, or acoustic vibe.
In this lesson, you’ll learn how regression models uncover hidden relationships between musical features and success, and how to use the metrics that turn raw data into real-world insights.

Regression metrics
Regression analysis is used to predict continuous random variables like cost, weight, or time. To evaluate these models, we compare predictions against actual known values to see "how far off" they are on average.
Scenario: Spotify popularity
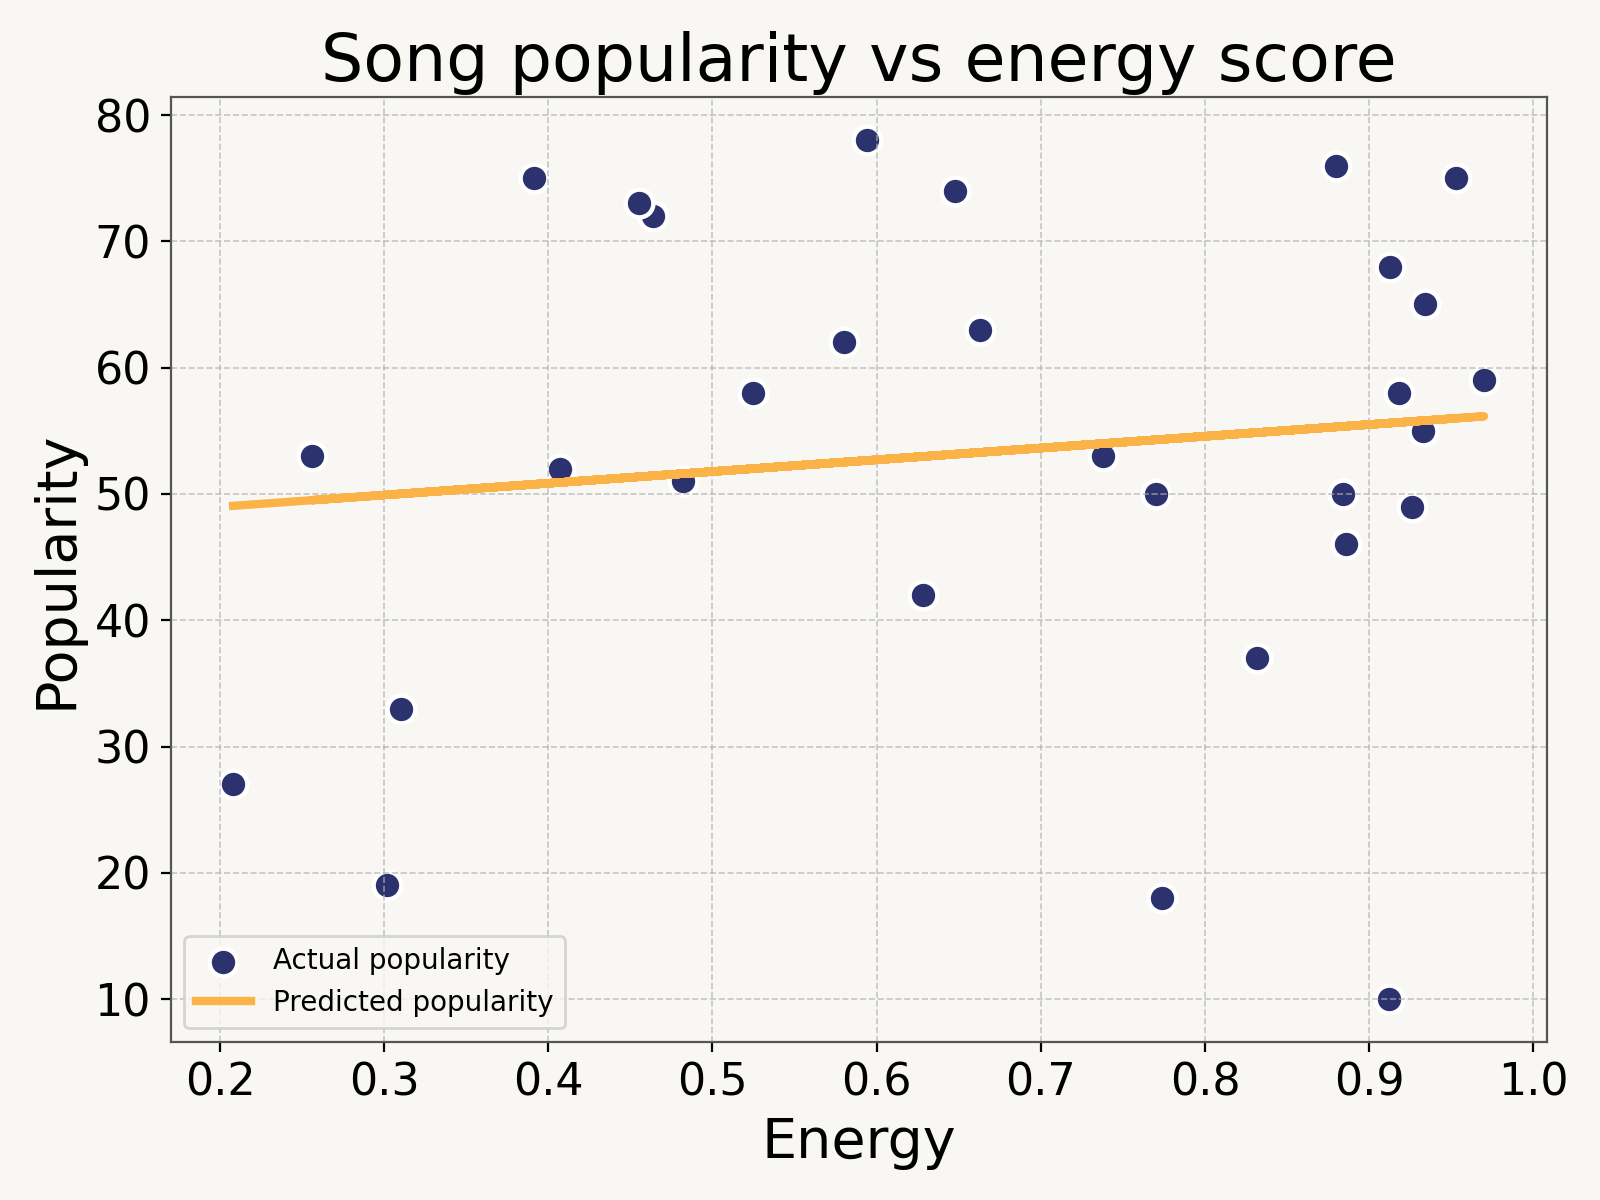
You work for a music label using the Spotify API. Your goal is to predict a song’s popularity score (continuous) based on musical components like energy, danceability, and tempo.
Key regression metrics
1. Mean Squared Error (MSE)
We calculate the residuals (differences between prediction and actual), square them to remove negatives, and find the mean.Formula: MSE = Σ(y_i - ŷ_i)² / n
In this case, the MSE is 319.5. The smaller the MSE, the better the model.
2. Root Mean Squared Error (RMSE)
MSE is hard to interpret because the units are squared. Taking the square root returns the metric to the same scale as the original data.
Formula: RMSE = √MSE
The RMSE for our music model is 17.9, meaning predictions are off by 17.9 points on average.
3. Mean Absolute Error (MAE)
Instead of squaring, we take the absolute value of the residuals. MAE is more robust if you have large outliers that you don't want to penalize too heavily.Formula: MAE = Σ|y_i - ŷ_i| / n

RMSE vs MAE: Which to choose?
- Pick MAE if: You have large outliers and want a robust average error measurement.
- Pick RMSE if: Large errors are particularly undesirable/costly, or if the error distribution is approximately normal.
Coefficient of determination (R-Squared)
R-squared tells us how much of the variance in the dependent variable is explained by our model.
- R² = 1: Perfect fit.
- R² = 0: No better than guessing using the mean.
- R² < 0: Worse than guessing using the mean.Formula: R² = 1 - (SS_res / SS_tot)
Our energy-based model returned an R-squared of 0.015, explaining only 1.5% of the variation in popularity. This suggests we need a more complex model or better features.

Action item: Tip
Comparing R-squared scores between training and test data is a critical step in identifying if your model is overfitting to specific patterns in the training set.