Translating performance into business value
 Instruction and application
 Complete
Imagine you have managed to build the most optimized possible model for your project - it has strong metrics and isn’t overfitting.

However, it is so complex that your non-technical stakeholders cannot understand the insights it produces - is it a good model?
Generally, we don’t train models for fun but to achieve specific business aims. When evaluating our models, we must also consider the real value they produce for our organizations.
Business relevant metrics
 Whether you work in Fintech, healthcare, education, property, local government (or any domain), there will be specific key performance indicators (KPIs) that matter to your organization.
These are targets that will have been agreed when the project was first scoped and what it will be measured against when ready.
These targets often involve translating the implications of the model predictions into tangible outcomes like:
- Cost saving.
- Revenue generation.
- Customer satisfaction improvements.
- Risk reduction. Focusing on business-relevant metrics means that our model development is aligned with organizational goals. A technically superior model might not be valuable if it doesn’t provide an obvious return on investment (ROI).
By optimizing metrics that directly influence the strategic objectives, we can prioritize improvements that yield the greatest ROI.
Cost-sensitive metrics, in particular, force us to consider the consequences of our model’s mistakes leading to more practical and impactful solutions.
Here are some examples:
Recommendations systemIf you are building a recommendations system, instead of measuring click-through rate, focus on the increase in average order value or conversion rate of recommended items.Fraud detectionIn a fraud detection algorithm, both precision and recall are important, with a business-relevant metric being the total amount of fraudulent transactions prevented.Predictive maintenanceWith predictive maintenance, instead of focusing on the accuracy of predicting machine failures, go for a business metric of a reduction in unscheduled downtime or cost saving in maintenance.
Tip
Aligning your model’s performance to your organizational goals will ensure that the ROI and impact it will have is maximized, creating more value for your organization.
Interpreting metrics
If nobody can understand your model, what was the point in training it?
These metrics are about understanding the nuances and limitations of the various metrics we use. No single metric tells the whole story and sometimes different metrics can provide conflicting messages.
Our job is to communicate our model's performance effectively to non-technical stakeholders using visualizations and clear explanations, highlighting what the performance metrics mean in a practical sense and any caveats associated with them.
If we don’t focus on this, we risk stakeholders misinterpreting metrics which can lead to flawed conclusions and incorrect decisions.
For example, a classification model predicting a rare disease with a high accuracy score might be misleading. If the data is imbalanced, the model may just be predicting everything as not having the disease.
Recognizing the limitation of accuracy in this situation means that you would use recall instead as it will show how well the model is picking up the instances where the disease is present. If the recall is low, the model will be practically useless.
Understanding the limitations of performance metrics allows us to choose the right metrics for our problem and avoid being misled by seemingly good results. Effectively communicating these interpretations to stakeholders builds trust and ensures that business decisions are well informed.
Additionally, visualizations can be effective tools for communicating performance metrics as they can show how the model is improving over time or to compare different models in a way that is intuitive for non-technical stakeholders.
But they are only useful if they are formatted well and not misleading.
Good practice would be to:
-
Include informative (and accurate) labels and titles.
-
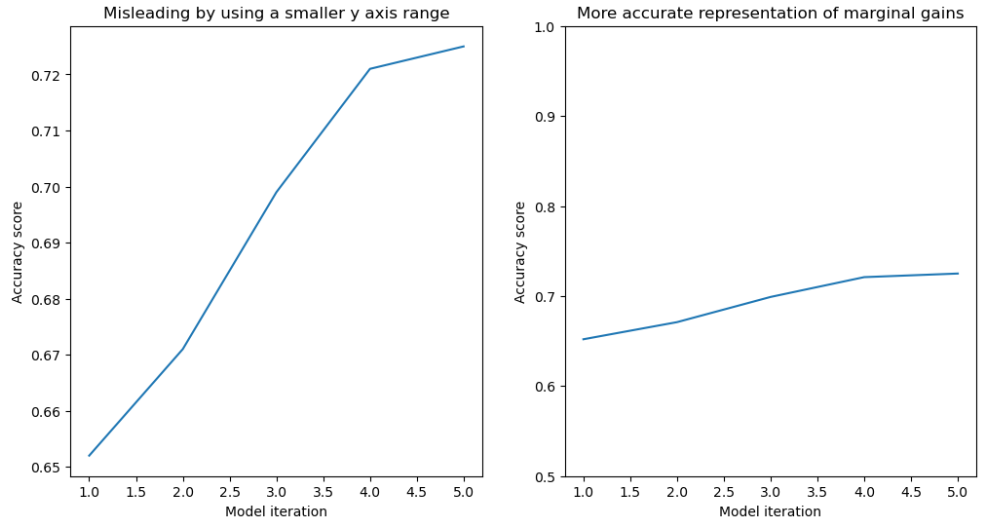
Use axis scales that are representative of the data (e.g. don’t represent a narrow data range with a large axis scale).
-
Limit the amount of information provided on a visualization to avoid clutter.
-
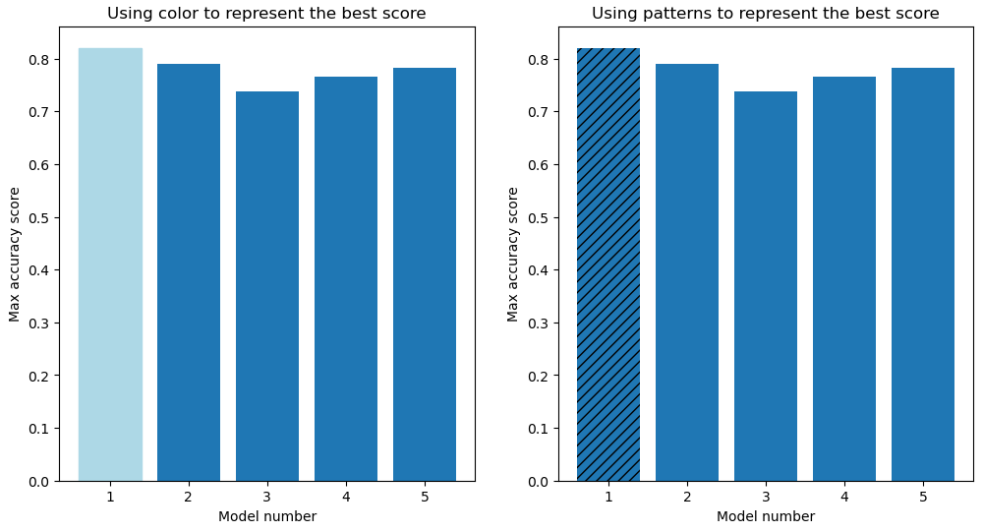
Use contrasting colors or patterns to highlight key information to make it easier for stakeholders with visual impairments or dyslexia.


Tip
When communicating your model’s performance to stakeholders, make sure you are selecting the metrics which most accurately capture the true picture and are using explanations or visualizations which make it easier for non-technical stakeholders to understand.
Sustainability metrics
Alongside performance and business goals, we also have a responsibility to focus on the environmental and computational resources required to train, deploy and maintain our models.
As models become more complex and datasets grow larger, the computational cost and environmental impact of training and running these models are becoming significant concerns.
We should therefore build in metrics that encourage us to be more mindful of the environmental impact, including:
Time to convergenceComparing different model architectures or optimization algorithms based on how quickly they reach a satisfactory performance level on the training data. A model that converges much faster can save significant computational time and resources.CO2 emissionsChoosing more efficient algorithms or hardware can lead to substantial reductions in CO2 emissions. For example, training a large language model on GPUs for an extended period can have a significant carbon footprint compared to a smaller model or a more efficient training strategy.Inference latencyMeasuring the time it takes for a deployed model to generate a prediction. Lower latency is crucial for real-time applications and improves user experience. Optimizing model size and architecture can reduce inference latency.Model size and memory footprintSmaller models require less memory and can be deployed on resource-constrained devices (e.g., mobile phones, embedded systems). Techniques like model compression (quantization, pruning) can reduce model size and improve efficiency.Energy consumptionMonitoring the energy usage of the infrastructure used for training and inference, especially in large-scale deployments. Choosing energy-efficient hardware and optimizing resource utilization can lead to cost savings and a reduced environmental impact.
Optimizing for sustainability can lead to more efficient model development processes, reduced operational costs, and a smaller carbon footprint.
Faster convergence times mean quicker iteration cycles. Lower CO2 emissions align with environmental responsibility and can be a factor in regulatory compliance or public perception.
Efficient inference reduces latency and resource requirements, leading to better user experiences and lower deployment costs.
Knowledge check
See if you can apply what you've learned by using the following information to answer the questions below.
In this exercise, you are working at a subscription based e-commerce company and have been part of a project to identify customers who are likely to become “high-value” subscribers in the first month.
- You trained a classification model to predict whether the customer will be high value (positive class) or not (negative class) based on their initial activity and demographics.
- After evaluating the model on a held-out test set of 1000 new customers, the following confusion matrix was obtained: Predict: High-valuePredict: Not high-valueActual: High-value6020Actual: Not high-value40880- The company's current marketing campaign targets all new subscribers, costing £5 per subscriber.
- Identifying high-value subscribers early would allow for a more focused and potentially more effective campaign with a higher budget per identified high-value customer. Use this information to complete the knowledge check below.